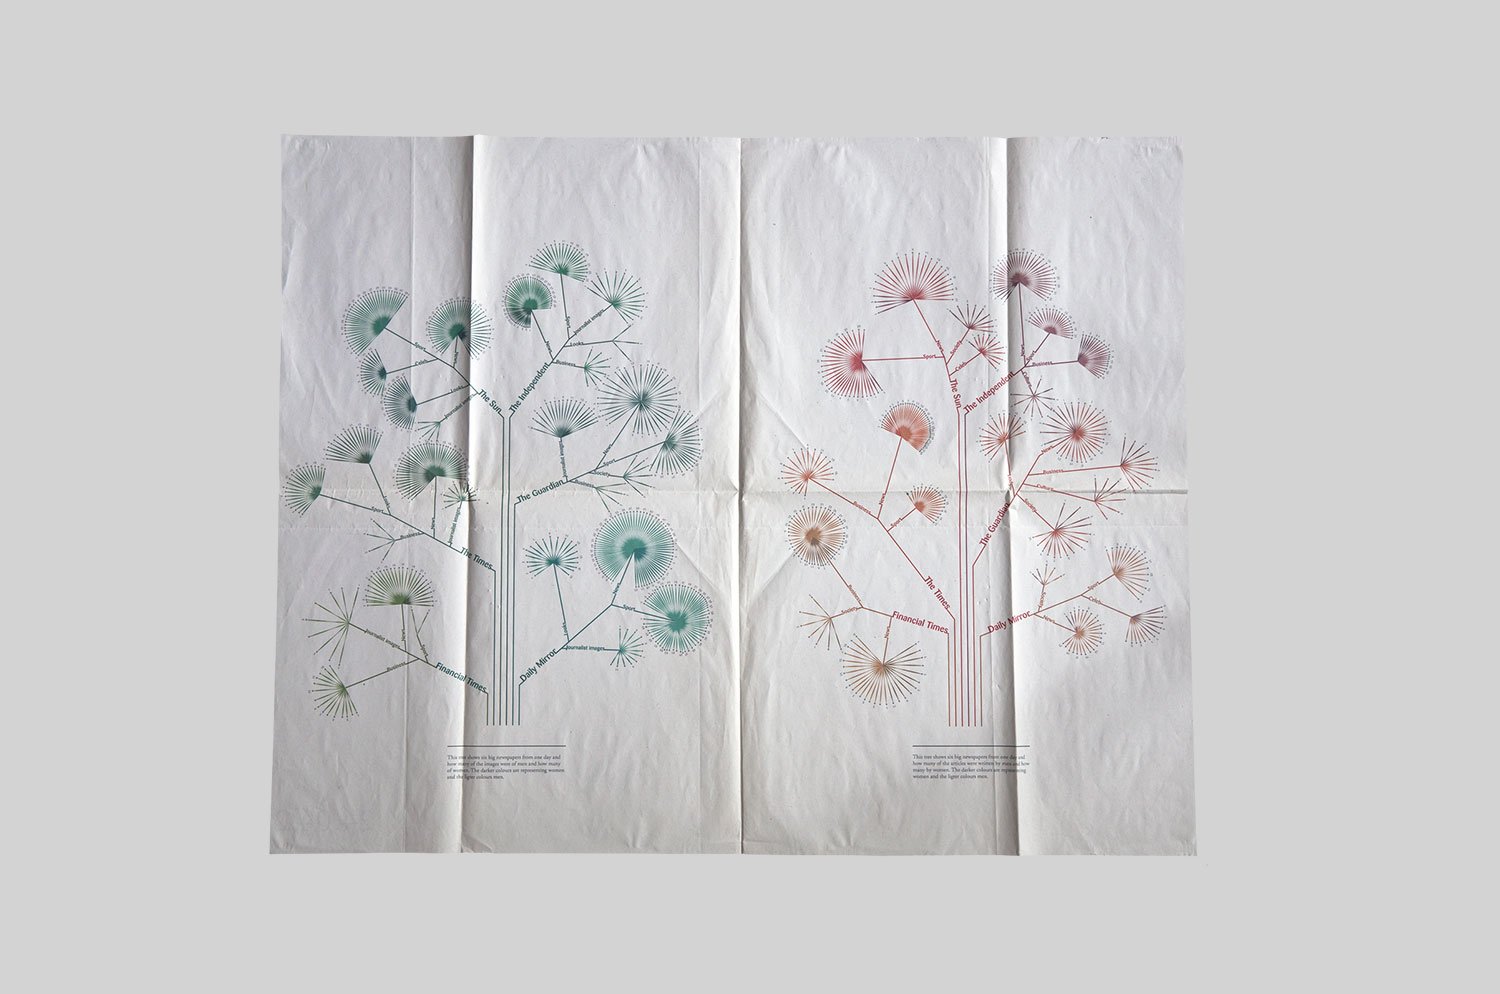
Hyperbolic Tree
This piece of infographics was designed to analyse and compare 6 different newspapers from one day. The data I was interested in was what amount of the articles were written by men and what amount were written by women and in which sections they were in. I then compared it to the amount of images of women and the amount of images of men in each section. The green ‘tree’ shows the data on the articles and the orange ‘ Tree’ the data on the images. Next to each other they make an interesting comparison and allows the information to speak for it self.